
Campaign foundations
Organize campaigns to distinguish discovery from high-intent product searches and make spend easier to evaluate.
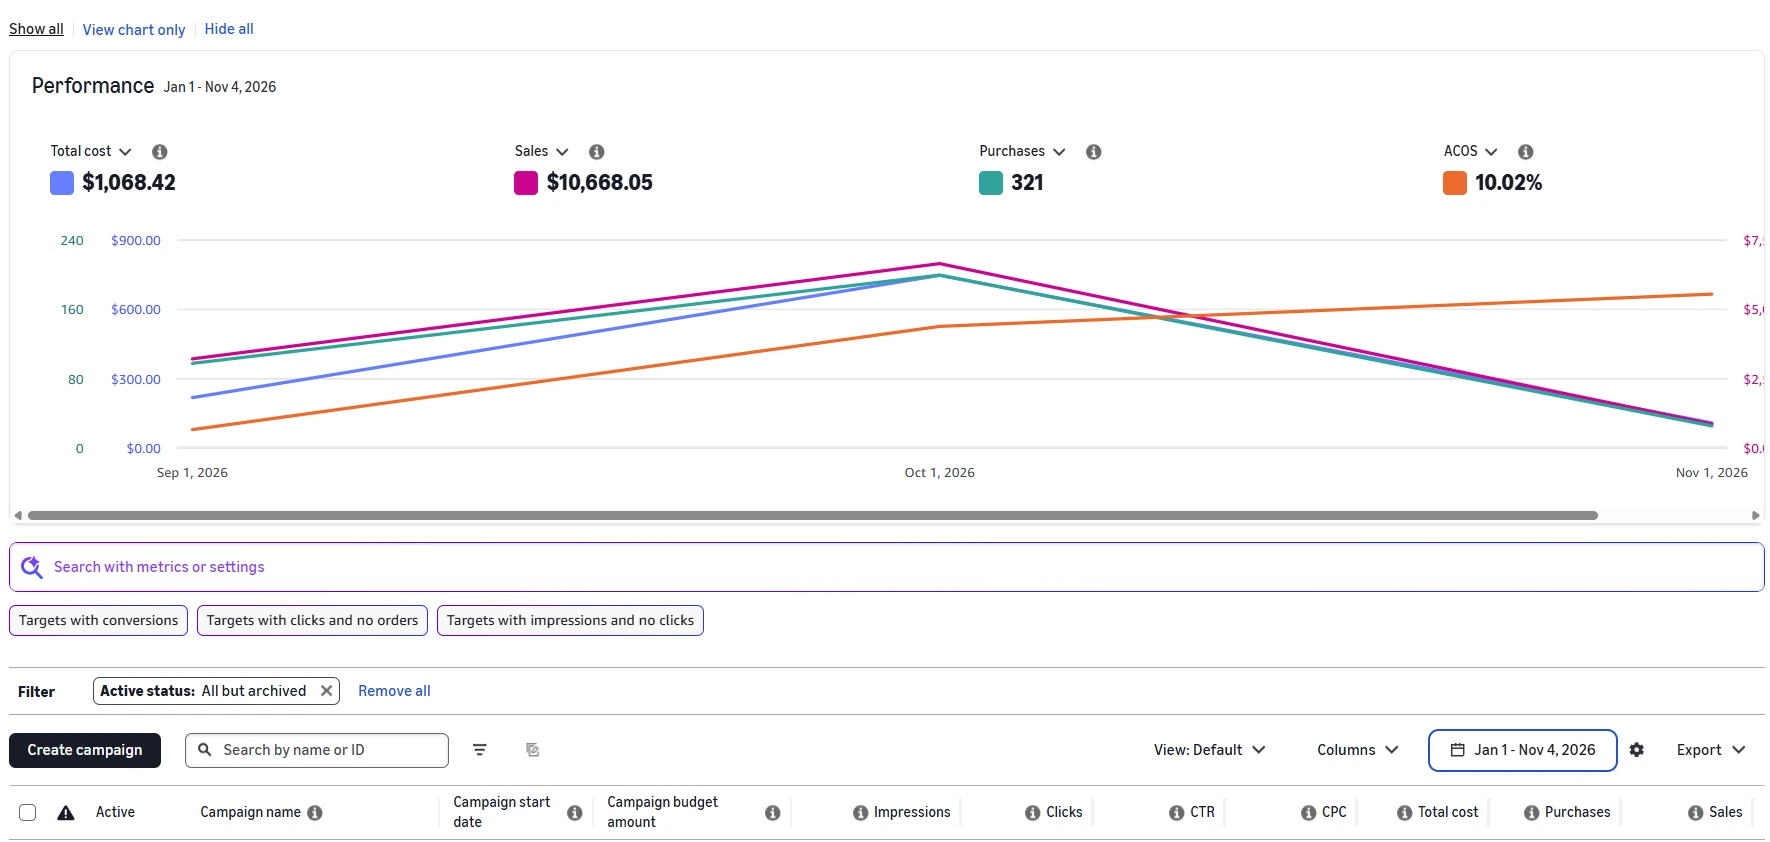
A food brand’s Amazon advertising snapshot shows $10.6K in PPC-attributed sales and a 10.02% advertising cost of sales.
A clear look at the account results, the campaign approach described for the engagement, and the actual Amazon reporting screenshots — with measurement dates stated openly.
Client name withheld. Figures are historical dashboard snapshots, not projected results.
These numbers come directly from the supplied Amazon Ads screenshot. The screenshot shows a Jan 1–Nov 4, 2026 date selection; it does not isolate the approximately 50 days after onboarding.
Reporting context: The brand was described as onboarded on September 15, 2026. The advertising screenshot was captured November 4, 2026 with a January 1 start date, so these PPC totals cannot be attributed solely to a 50-day post-onboarding period. ROAS of 9.98× is calculated from the displayed ad sales and spend.
The food brand’s engagement brief focused on improving Amazon advertising structure and maintaining cost discipline. For category shoppers, relevance matters: broad traffic alone is not a performance strategy.
Organize campaigns to distinguish discovery from high-intent product searches and make spend easier to evaluate.
Prioritize keywords connected to likely product demand instead of optimizing for clicks without buying intent.
Use spend and conversion signals to refine bids, search terms and budget allocation over time.
The strategy above summarizes the supplied engagement description. Dashboard screenshots establish performance totals but do not independently prove individual campaign actions or their causal contribution.
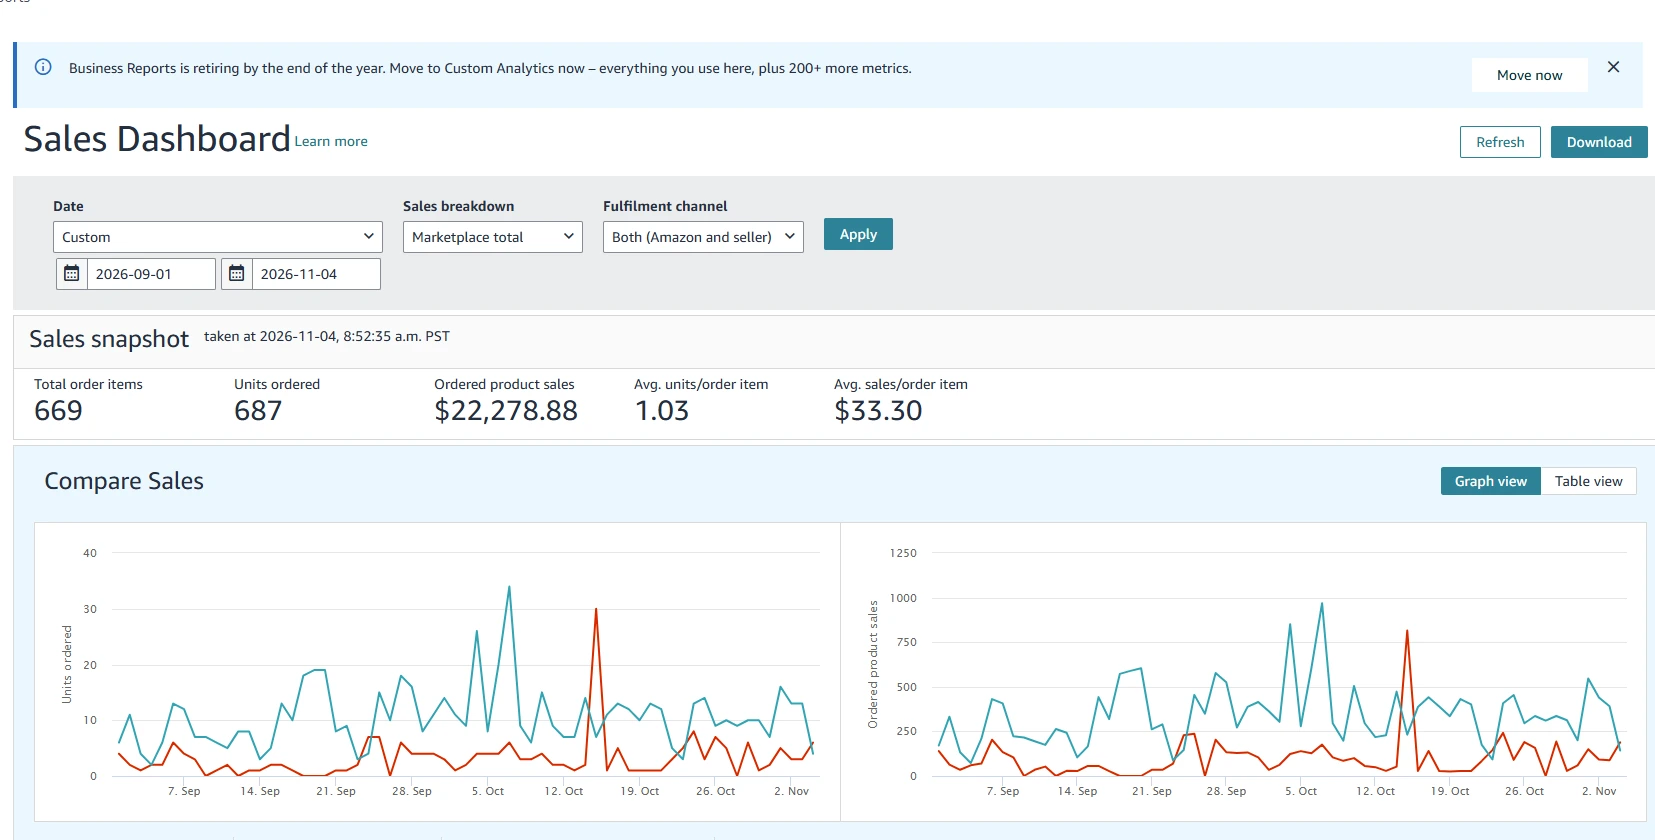
A separate Amazon Business Reports screenshot shows total ordered product sales across September 1–November 4, 2026. These account-level totals are not the same measurement as PPC-attributed sales.
Two original screenshots supplied for this portfolio, shown without fabricated comparison periods or claims of incremental sales.
TechToTab's Amazon team can help with campaign structure, keyword targeting, budget discipline and performance reporting.