
Sharper targeting
Focus ad targeting on relevant, purchase-oriented search terms and product demand.
A home and kitchen accessories brand's reporting snapshot shows a move from a ₹38K net loss in October 2025 to ₹2.90 lakh net profit in January 2026.
Two comparable calendar months, three months apart, show higher sales with more efficient advertising. See the actual account-level and Amazon Ads evidence below.
Comparison of October 1–31, 2025 with January 1–31, 2026. Currency is Indian rupees. Business-level sales and net profit are taken from the supplied profitability dashboard, while PPC-attributed figures and ACoS come from the supplied Amazon Ads screenshots.
| Metric | Before · Oct 2025 | After · Jan 2026 |
|---|---|---|
| Total sales (account-level) | ₹4,80,927 | ₹18,09,157 |
| Net profit | −₹38,339 | +₹2,89,928 |
| PPC-attributed sales | ₹1,97,204.06 | ₹9,38,875.27 |
| Amazon Ads cost | ₹1,49,706.83 | ₹2,86,467.12 |
| ACoS | 75.91% | 30.51% |
| Orders (account-level) | 1,872 | 5,827 |
The January profitability dashboard also shows gross profit of ₹3,26,528.35. This case study uses the separate net profit ₹2,89,928.35 value to avoid confusing gross and net results. January ad spend increased in absolute rupees while ACoS declined.
In October the brand was making sales, but the supplied reports recorded a net loss and a high 75.91% ACoS. The focus described for the engagement was not simply driving more traffic, but finding a more sustainable relationship between spend, sales and returns.
Focus ad targeting on relevant, purchase-oriented search terms and product demand.
Review expensive traffic and refine bids where sales response does not justify spend.
Prioritize campaign opportunities with stronger observed revenue efficiency.
These are the strategic approaches described in the supplied project narrative, not individually verifiable actions from the screenshots. The screenshots substantiate the before-and-after account outcomes, not which action caused them.
Three selected screenshots show advertising efficiency and the profitability comparison. Any account identifier in the profitability image has been omitted for privacy.
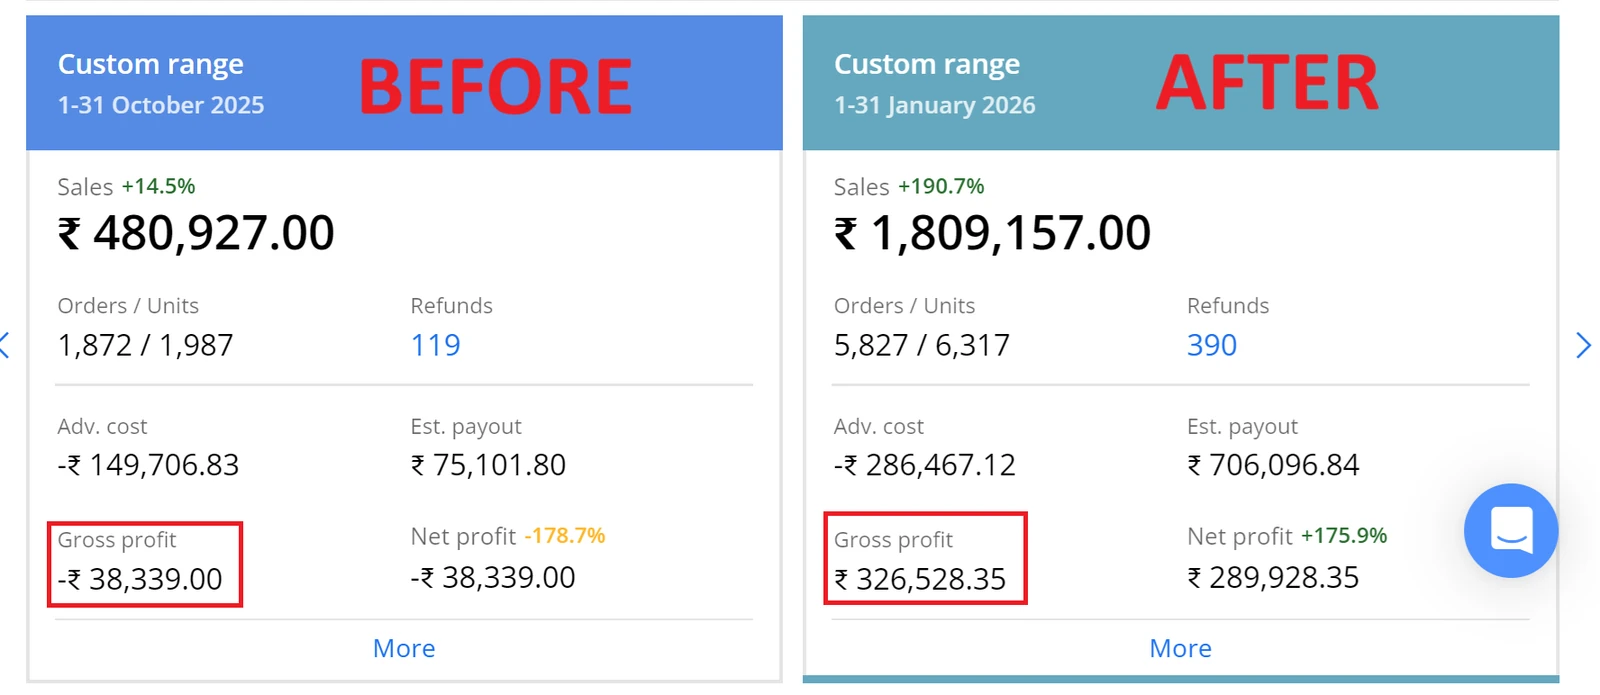
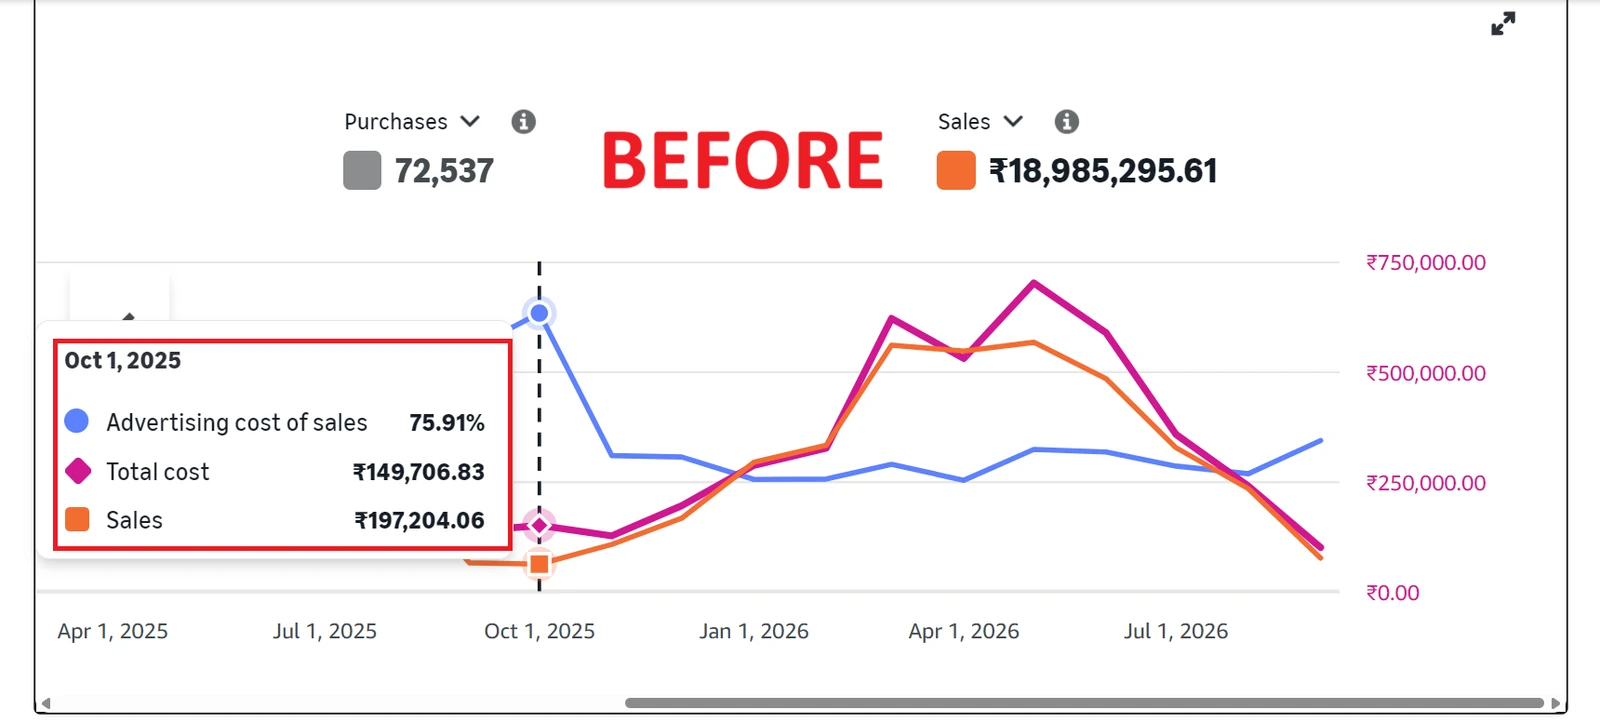
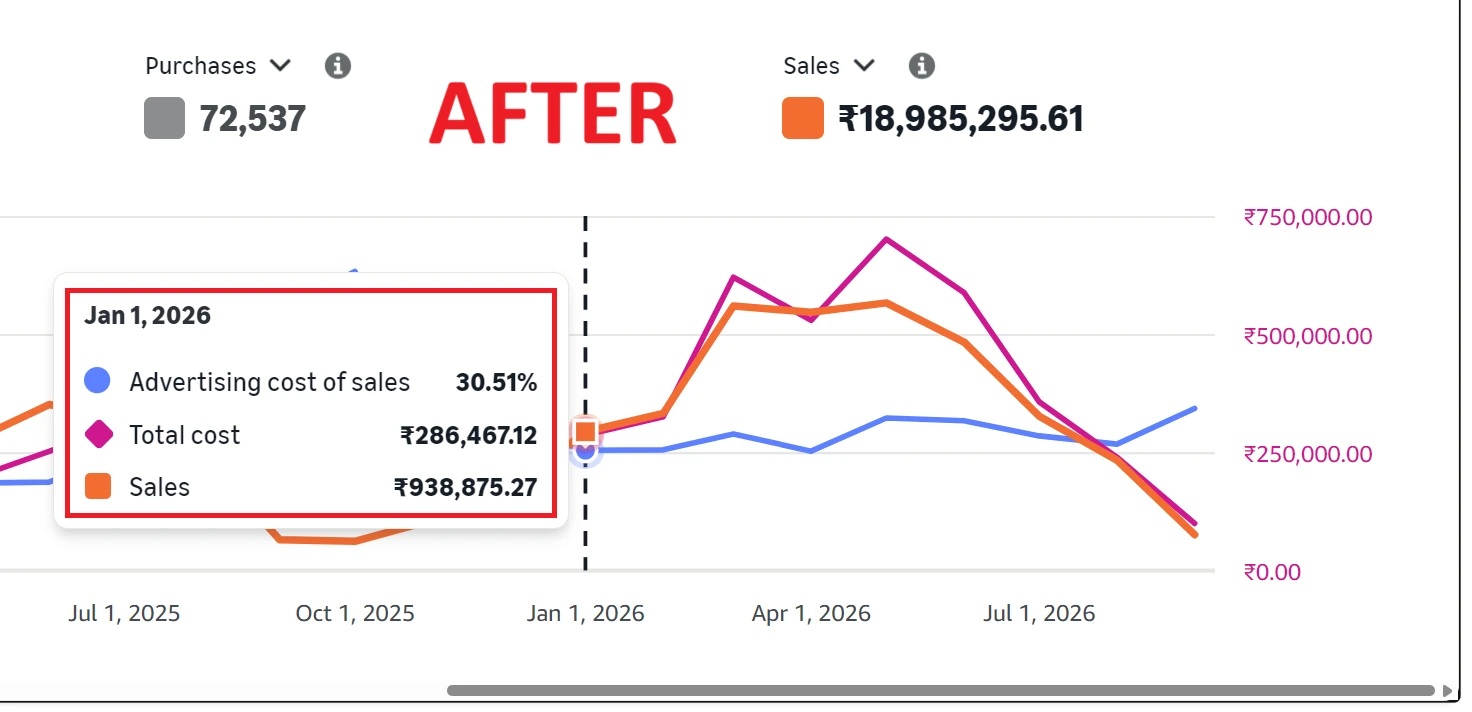
Across the two documented reporting months, account-level sales increased from ₹4.81 lakh to ₹18.09 lakh while net profit changed from negative to positive. In the same comparison, PPC ACoS improved by 45.40 percentage points, from 75.91% to 30.51%.
These figures describe the observed account comparison. They do not isolate the effects of every ad optimization, seasonal changes, price changes or other operational factors, and historical performance does not guarantee future results.
Discuss your Amazon goals