
Campaign restructuring
Reorganized campaigns around clearer performance signals.
A multi-SKU Amazon account moved from inefficient advertising spend toward a more disciplined PPC structure. Across two consecutive 31-day reporting periods, documented sales increased while advertising costs declined.
Results from a documented Amazon advertising engagement. Account and client details are withheld. Historical results are not a guarantee of future outcomes.
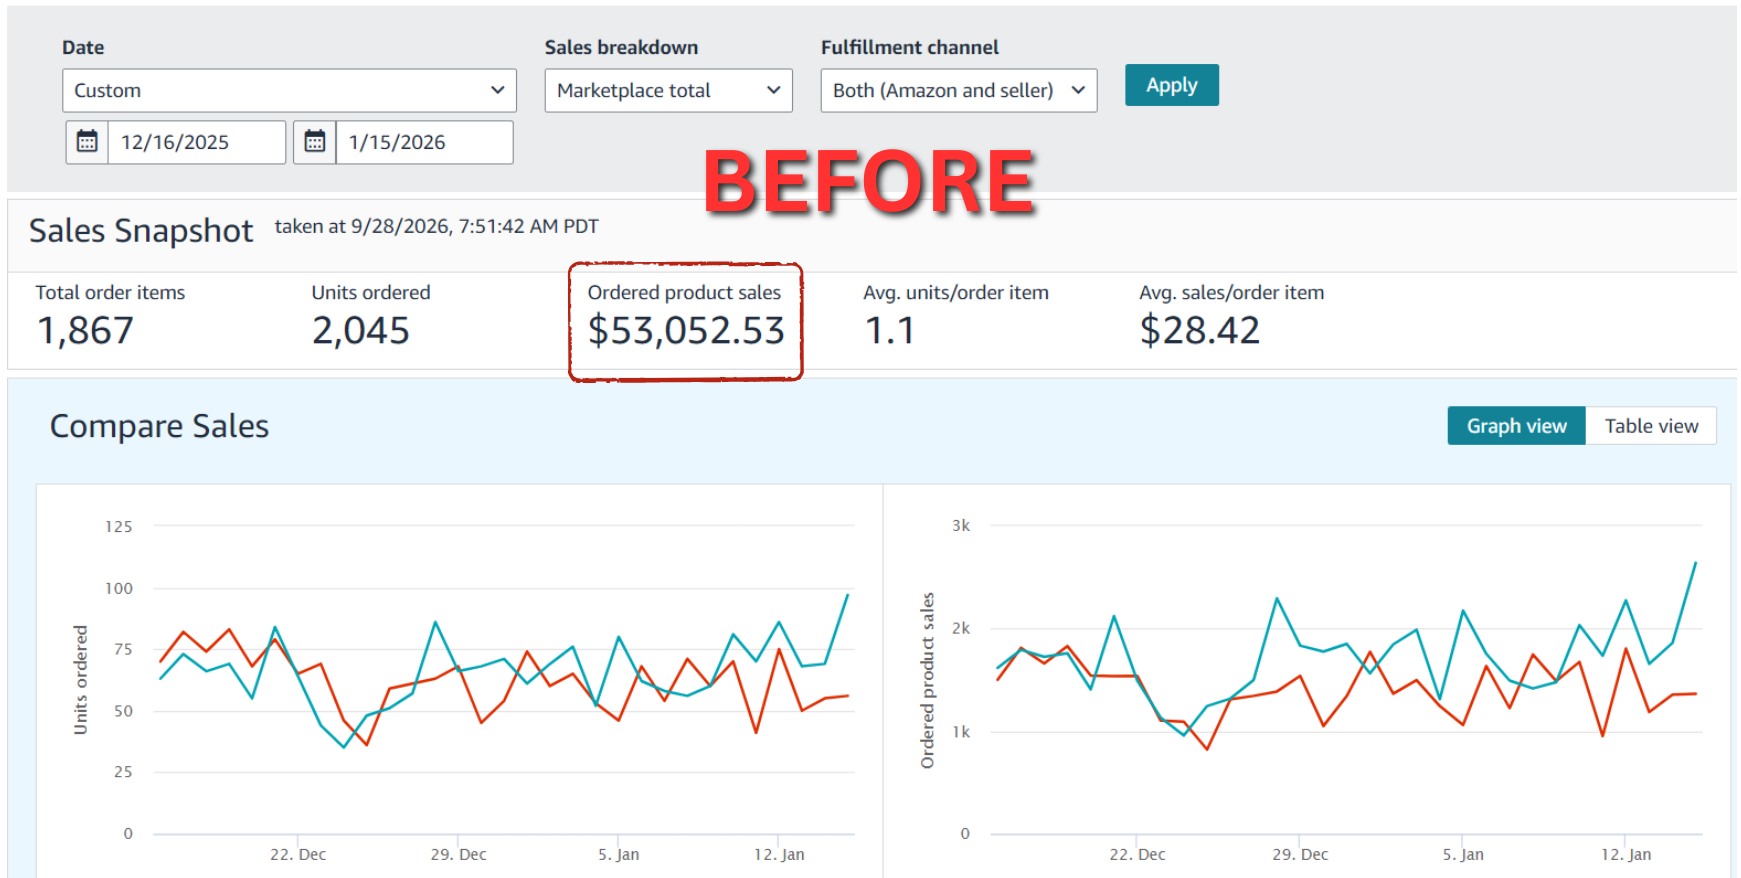
Prior-period revenue exceeded $53,000, but PPC cost was high relative to ad-attributed sales. The documented improvement focused on campaign structure, bid discipline, search-term efficiency and smarter budget allocation.
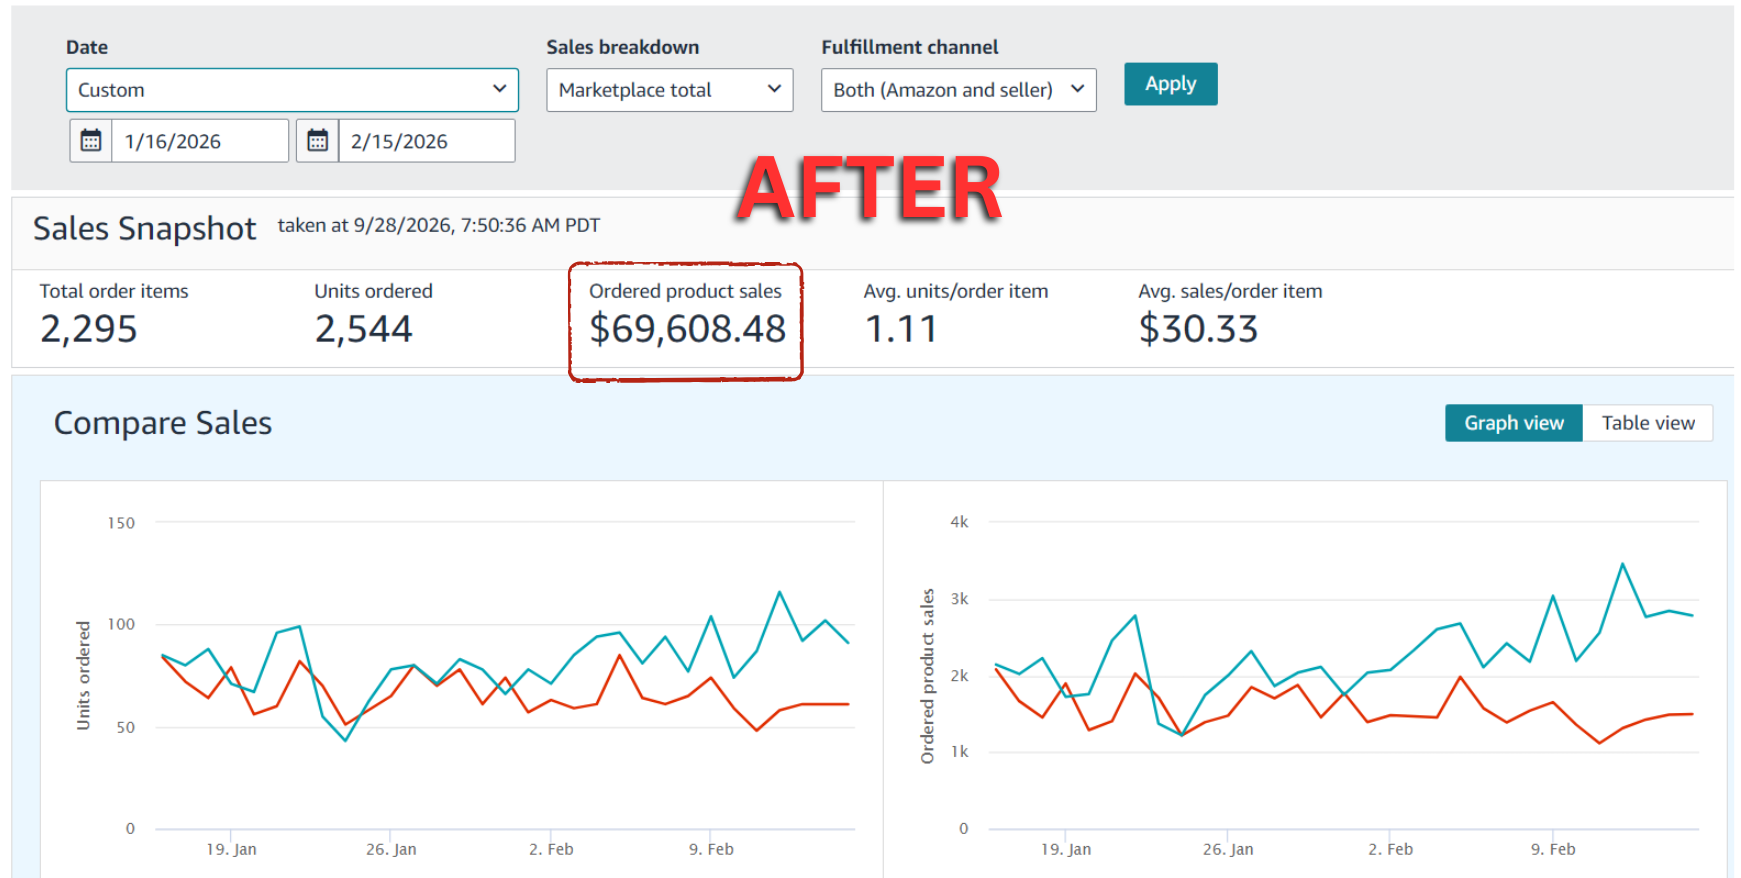
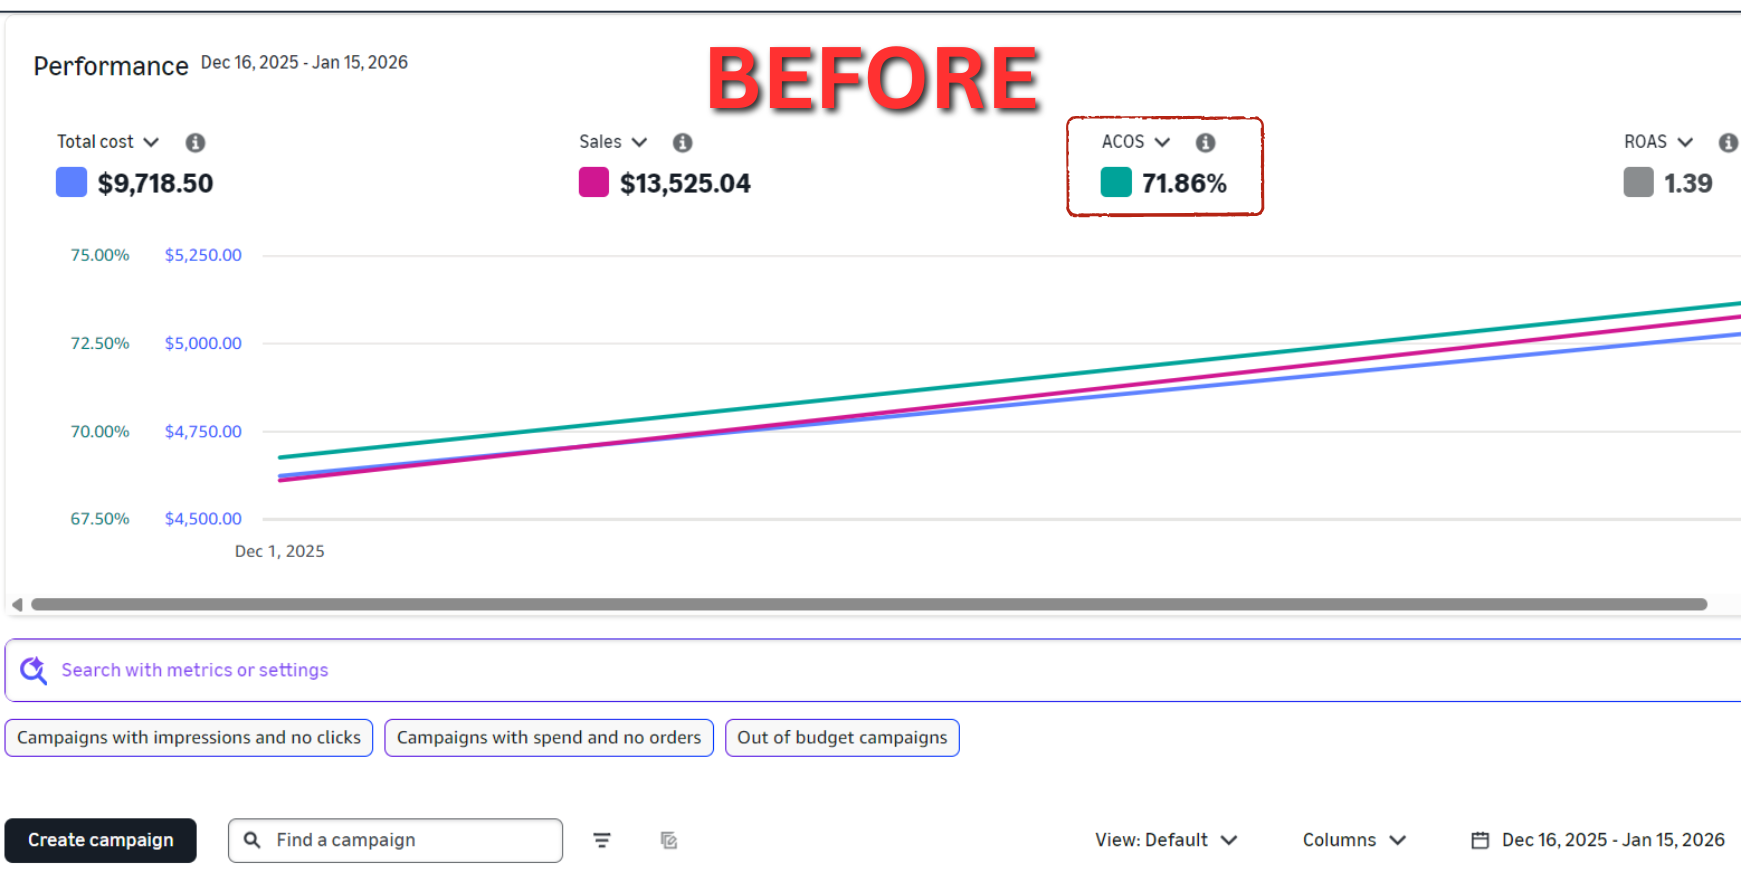
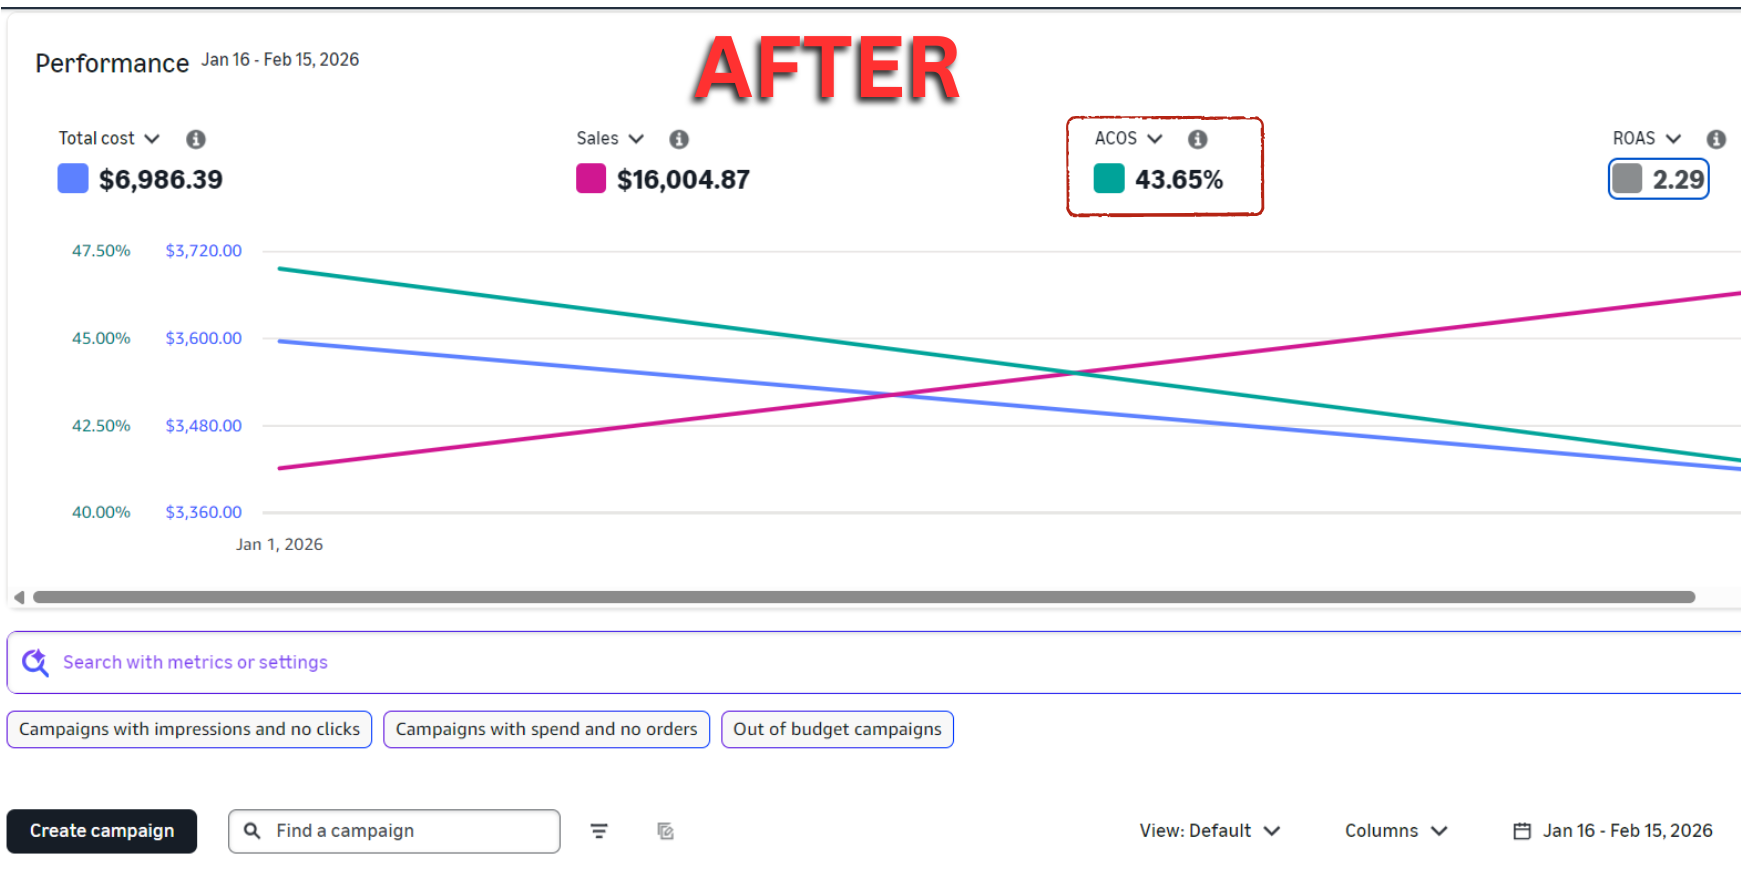
Reporting windows: December 16, 2025–January 15, 2026 versus January 16–February 15, 2026. Monetary figures are USD. PPC figures are advertising-attributed; total sales and net profit are account-level dashboard figures.
| Metric | Before | After | Change |
|---|---|---|---|
| Total sales | $53,052.53 | $69,608.48 | +31.2% |
| Units ordered | 2,045 | 2,544 | +24.4% |
| Advertising spend* | $9,718.50 | $6,986.39 | −28.1% |
| PPC-attributed sales | $13,525.04 | $16,004.87 | +18.3% |
| ACOS | 71.86% | 43.65% | −28.21 percentage points |
| ROAS | 1.39 | 2.29 | +0.90 |
| TACOS | 18.32% | 10.04% | −8.28 percentage points |
| Net profit | $9,483.89 | $24,409.31 | +157.4% |
* The Sellerboard summary displays $6,987.41 in after-period advertising cost, while the Amazon Ads dashboard shows $6,986.39. We use the Amazon Ads figure for PPC comparisons and preserve the dashboard discrepancy transparently.
The supplied case-study documentation describes five operational improvements made during the engagement.
Reorganized campaigns around clearer performance signals.
Reduced bids where conversion did not justify click costs.
Reduced inefficient keyword and targeting expenditure.
Moved budget toward opportunities with stronger observed performance.
Adjusted placement exposure in line with available performance data.
The source also describes selective promotion, image and content improvements. The screenshots show performance changes, but they do not independently isolate the causal effect of each intervention.
Original Amazon Ads and Business Reports screenshots supplied for this case study, retained with their visible reporting dates and metrics.
From keyword targeting and campaign architecture to placement and budget decisions, explore how TechToTab's Amazon advertising team can support your next engagement.